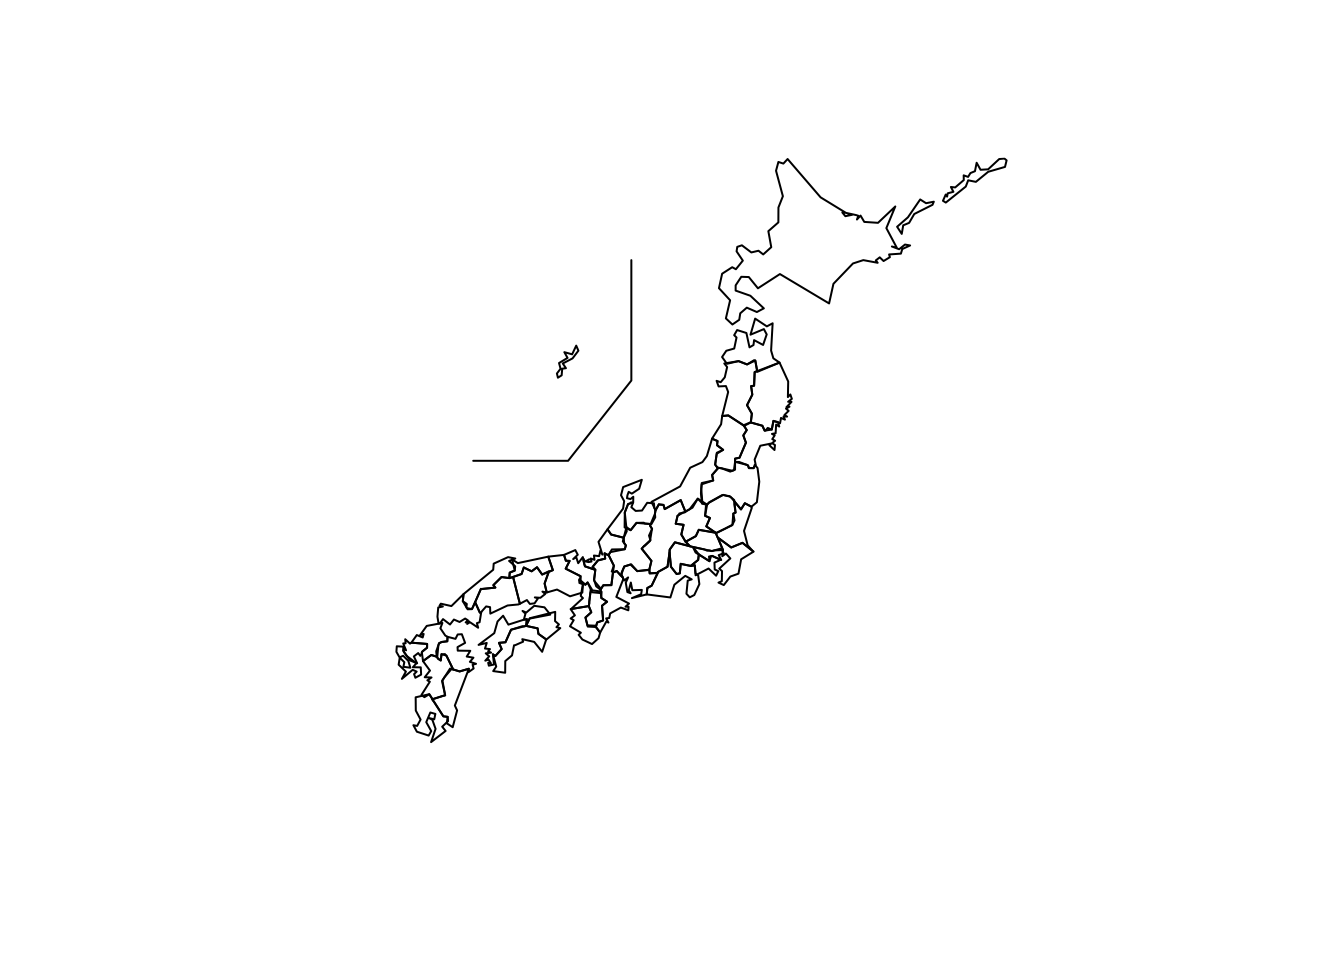
NipponMap::JapanPrefMap()
Kazuki Tamura
2024年8月25日
都道府県の塗り分け地図を簡単に描くには,NipponMapパッケージのJJapanPrefMap関数が便利です。
これと同じような図を,ggplot2を利用して描くggJapanPrefMap関数を書きました。 実は数年前にggJapanPrefectureMapという関数を作ったことがあったのですが、内部で使っている関数(パッケージ)が古くなってしまって、実質的には使えない関数になっていたので、書き直した感じです。
関数は以下のようなものです。
ggJapanPrefMap <- function (col = NULL, inset = TRUE, ...)
{
  require(sf)
  require(ggplot2)
  if(is.null(col)){
    col <- rep(NULL, 47)
  }else{
    if (!is.factor(col)) col <- as.factor(col)
  }
  shp <- system.file("shapes/jpn.shp", package = "NipponMap")[1]
  m <- st_read(shp, quiet = TRUE) |> st_set_crs(4326) |>
    st_transform("+proj=aeqd +lat_0=35.65802414 +lon_0=139.74143256 +x_0=0 +y_0=0 +datum=WGS84 +units=km +no_defs")
  m$col = col
  if (inset) {
    m$geometry[[47]] <- m$geometry[[47]] + c(500, 1400)
  }
  p <- ggplot() + geom_sf(aes(fill = col), data = m) + theme_void() +
    guides(fill  = guide_legend(position = "inside")) +
    scale_fill_discrete() +
    theme(legend.title = element_blank(),
          legend.margin = margin(0, 0, 0, 0),
          legend.position.inside = c(0.9, 0.1),
          legend.justification.inside = c(1, 0))
  if (inset) {
    p <- p + geom_path(data = data.frame(lon = c(-800, -600, -400, -400), lat = c(200, 200, 400, 600)),
                       mapping = aes(x = lon, y = lat), color = "black", linewidth = 0.2)
  }
  return(p)
}
こんな感じの都道府県塗り分け地図を書くことができます。
ggplot2の関数を使って、凡例を消したり、パレットを変更したりできます。